Billing Dashboard
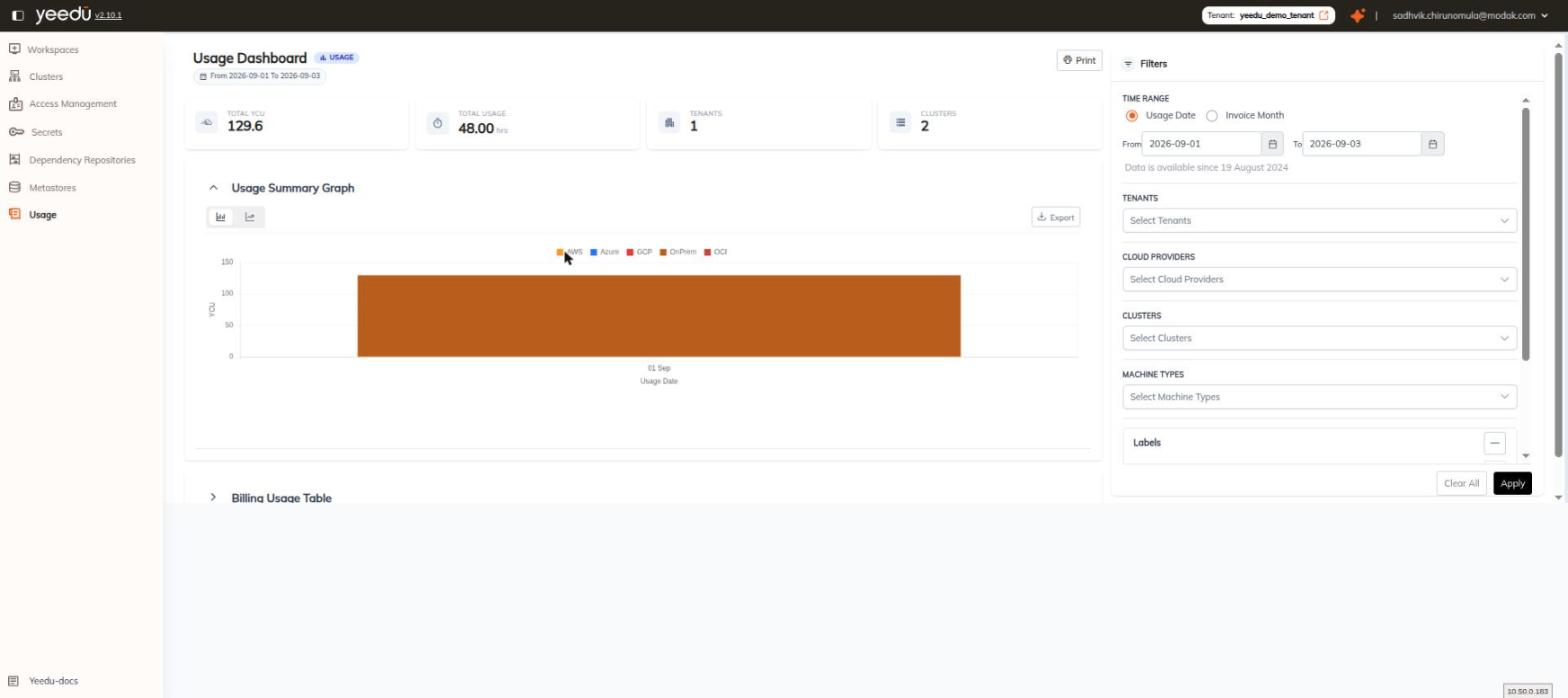
The Usage Dashboard (also referred to as the Billing Dashboard) monitors and calculates resource consumption in Yeedu Compute Units (YCU) across tenants. It summarises usage for a selected date range, charts it by cloud provider, lists it row by row, and lets you narrow it down by tenant, cloud provider, cluster, machine type and label. Everything on the page answers to the date range carried in the query string and to whatever is selected in the Filters panel: the four KPI cards, the Usage Summary Graph and the Billing Usage table all move together.
Accessing the dashboard
Open Usage in the left navigation. The dashboard is served from a tenant-less, top-level route:
/billing-dashboard/usage?start_date=YYYY-MM-DD&end_date=YYYY-MM-DD
- The reporting window is carried in the query string.
start_dateandend_datedefault to the first day of the current month through today. - There's no
/tenant/<id>/usageroute, and no/tenant/<id>/billing-dashboard/usageroute. Requesting either returns the 404 PAGE NOT FOUND screen. We keep the dashboard at the top level, regardless of which tenant you were last working in.
Page header
| Element | Description |
|---|---|
| Usage Dashboard | Page title |
| USAGE | Badge shown next to the title |
From <start> To <end> | Date chip echoing the range currently in effect |
| Opens a print view of the dashboard (top right of the content area) |
The Filters panel is docked along the right-hand side of the page.
Key metrics
Four KPI cards run across the top of the dashboard, left to right. Each reflects the currently applied date range and filters.
| Card | Meaning |
|---|---|
| TOTAL YCU | Yeedu Compute Units consumed in the selected range |
| TOTAL USAGE | Aggregate runtime for the range, in hours |
| TENANTS | Number of tenants contributing usage in the range |
| CLUSTERS | Number of clusters contributing usage in the range |
Usage Summary Graph
A collapsible section, expanded by default, plotting YCU consumption over time stacked by cloud
provider. The Y axis is labelled YCU; the X axis is labelled by the selected time-range mode
(for example Usage Date).
-
Chart type toggle : a two-button control at the top left switches between a bar chart (the default) and a line chart.
-
Export : a button at the top right opens a menu with exactly three formats:
Format Output PNG Raster image of the chart SVG Vector image of the chart CSV The chart's underlying data
The chart legend lists cloud providers in a different order from the CLOUD PROVIDERS filter. We treat the filter order as the canonical one (see Cloud provider order); the legend order is presentational only and shouldn't be read as authoritative.
Billing Usage Table
A collapsible section, collapsed by default. Expand it to reveal the Billing Usage table, which lists one row per tenant / cluster / machine type / date combination. All seven columns are sortable.
| Column | Description |
|---|---|
| Tenant | Tenant associated with the cluster usage |
| Cluster | Name of the cluster that was used |
| Machine Type | Machine type configured for the cluster |
| YCU/Hour | Hourly YCU rate for that machine type |
| Total YCU | YCU consumed, derived from the YCU/hour rate and the minutes of usage |
| Minutes Of Usage | Total duration the cluster remained active |
| Usage Date | Date on which the cluster was utilised |
Filters
The Filters panel is docked to the right of the dashboard. Its body is an independent scroll area, with Clear All and Apply buttons pinned in the footer.
| Button | Effect |
|---|---|
| Clear All | Resets every filter in the panel |
| Apply | Applies the current selections to the dashboard |
Time range
A TIME RANGE radio pair selects how the range is interpreted:
| Option | Behaviour |
|---|---|
| Usage Date (default) | The From/To controls are date pickers, pre-filled with the range currently in effect |
| Invoice Month | The same two controls switch to month selection, with Select From Date and Select To Date placeholders |
Each control carries a calendar button. A hint below the pickers states:
Data is available since 19 August 2024
Multiselect filters
Four multiselects narrow the data. Each opens an overlay with a built-in search box, and each accepts multiple values.
| Filter | Placeholder | Options |
|---|---|---|
| TENANTS | Select Tenants | Every tenant the signed-in user can see (a Platform Admin sees all) |
| CLOUD PROVIDERS | Select Cloud Providers | A fixed set — see below |
| CLUSTERS | Select Clusters | Cluster names across the visible tenants |
| MACHINE TYPES | Select Machine Types | Machine types present in the usage data, for example Standard_E8as_v4, c5ad.8xlarge, n1-standard-4, i3.xlarge, g4dn.2xlarge, Onprem-XS-4 |
Cloud provider order
The CLOUD PROVIDERS filter lists the supported providers in the canonical, product-wide order:
OCI · OnPrem · GCP · AWS · Azure
Labels
A bordered Labels sub-card filters usage by the labels attached to clusters. It supports one or more label filters:
| Control | Behaviour |
|---|---|
| Label 1 | Heading for the first label row; further rows are numbered in sequence |
| Select Key | Dropdown of the label keys actually in use on clusters |
| Select Value | Dropdown of that key's values — disabled until a key is chosen |
| Add Label | Adds another label row; disabled until the current key/value pair is complete |
Multiple filters can be combined. Selections take effect only after you choose Apply.
Print
The Print button at the top right of the content area produces a print view of the dashboard, which can be saved as a PDF from the browser's print dialog. The v2.10.x changelog states that this preview "shows applied billing filters".
We took the filter echo in the print preview from the changelog wording; we haven't verified it against a live instance.
Access control
We enable the Usage entry in the left navigation only for users holding the Platform Admin or Platform Billing platform role. For everyone else the entry is greyed out and non-clickable, with the tooltip You don't have sufficient privileges.
A user whose only role is Platform Billing and who isn't associated with a tenant is redirected straight to the Billing Dashboard on sign-in, with the date range pre-set to the first of the current month through today.