Monitoring
Cluster monitoring lives on the cluster detail page, which you reach by clicking a cluster name on the Clusters list.
The detail page has five tabs, Events, Configuration, Dependencies, JDBC and Access Management. And monitoring is entirely contained in the Events tab.
We don't ship a separate "Dashboard" tab, and there's no separate "Node-Level Monitoring" tab either. The Events
tab holds both, as the Cluster and Nodes sub-tabs.
Events tab
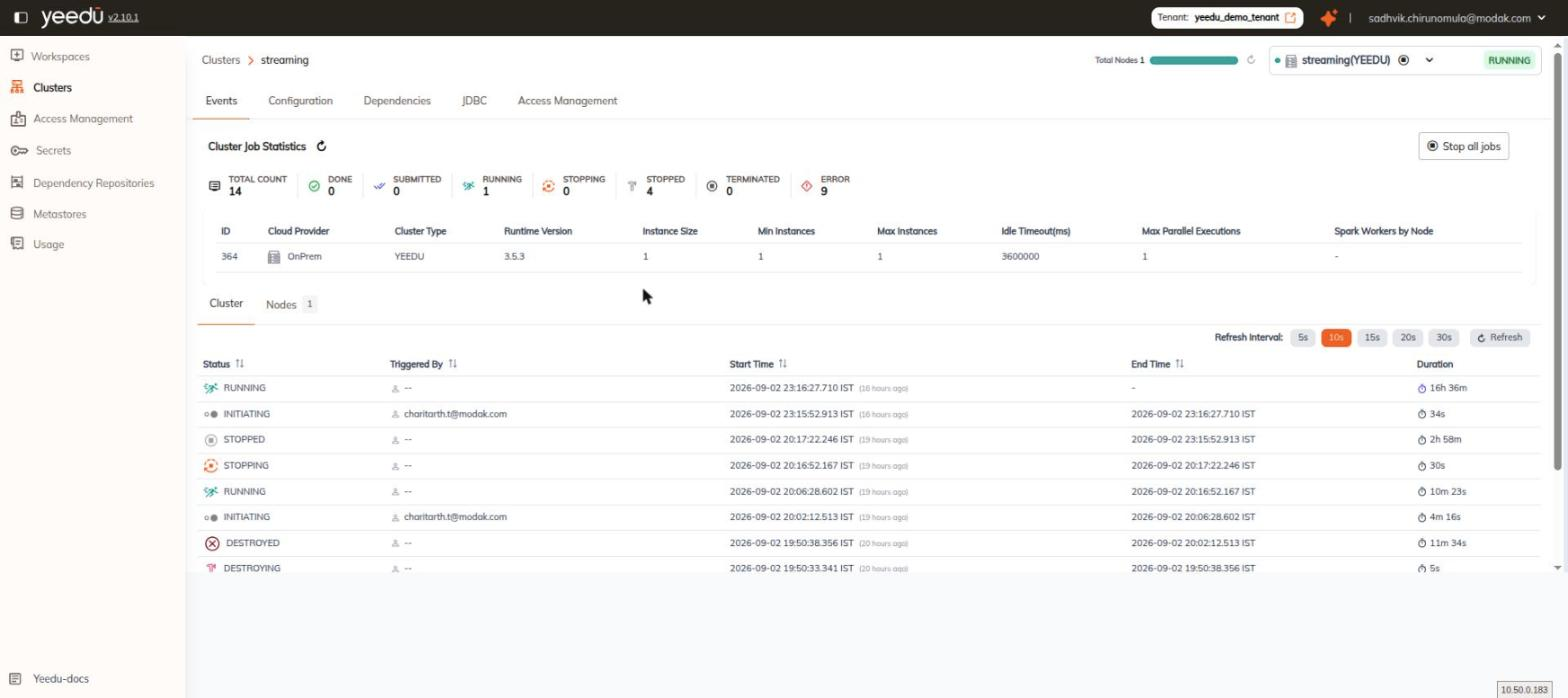
Cluster Job Statistics
The Cluster Job Statistics card sits at the top of the Events tab. It carries a refresh icon in its header and a Stop all jobs button on the right.
It shows eight counters:
| Counter | Meaning |
|---|---|
| TOTAL COUNT | All jobs recorded against this cluster |
| DONE | Jobs that completed successfully |
| SUBMITTED | Jobs accepted but not yet running |
| RUNNING | Jobs currently executing |
| STOPPING | Jobs in the process of being stopped |
| STOPPED | Jobs stopped by a user |
| TERMINATED | Jobs terminated by the platform |
| ERROR | Jobs that failed |
Cluster summary strip
Below the statistics card, a read-only strip repeats the cluster's key configuration in ten columns:
ID · Cloud Provider · Cluster Type · Runtime Version · Instance Size ·
Min Instances · Max Instances · Idle Timeout(ms) · Max Parallel Executions ·
Spark Workers by Node
Idle Timeout(ms) is the millisecond form of the Stop Each Instance After value set on the
Configuration tab, for example 3600000 ms for 60 minutes.
Refresh controls
Both sub-tabs share the same right-aligned control row:
- Refresh Interval: a segmented control offering 5s, 10s, 15s, 20s and 30s. 10s is the default.
- A Refresh button for an immediate, one-off refresh.
Cluster sub-tab
The Cluster sub-tab lists the cluster's lifecycle events, newest first.
| Column | Description |
|---|---|
| Status | The cluster state this event represents. Sortable. |
| Triggered By | The email address of the user who initiated the transition, or -- for system-initiated transitions. Sortable. |
| Start Time | When the state was entered, as YYYY-MM-DD HH:mm:ss.SSS IST with a relative hint such as (3 hours ago). Sortable. |
| End Time | When the state ended, in the same format. Sortable. |
| Duration | How long the state lasted, humanised — 16h 36m, 10m 23s, 34s, 5s — with a timer icon. |
Cluster status values
| Status | Meaning |
|---|---|
| INITIATING | The cluster is being provisioned |
| RUNNING | The cluster is up and accepting work |
| STOPPING | The cluster is shutting down |
| STOPPED | The cluster is stopped but not destroyed |
| DESTROYING | The cluster's resources are being torn down |
| DESTROYED | The cluster's resources are gone; the cluster is now editable |
| ERROR | The transition failed |
Nodes sub-tab
The Nodes sub-tab carries the per-node metrics, CPU, memory, disk, network and uptime, for
every node in the cluster, along with per-node log access.
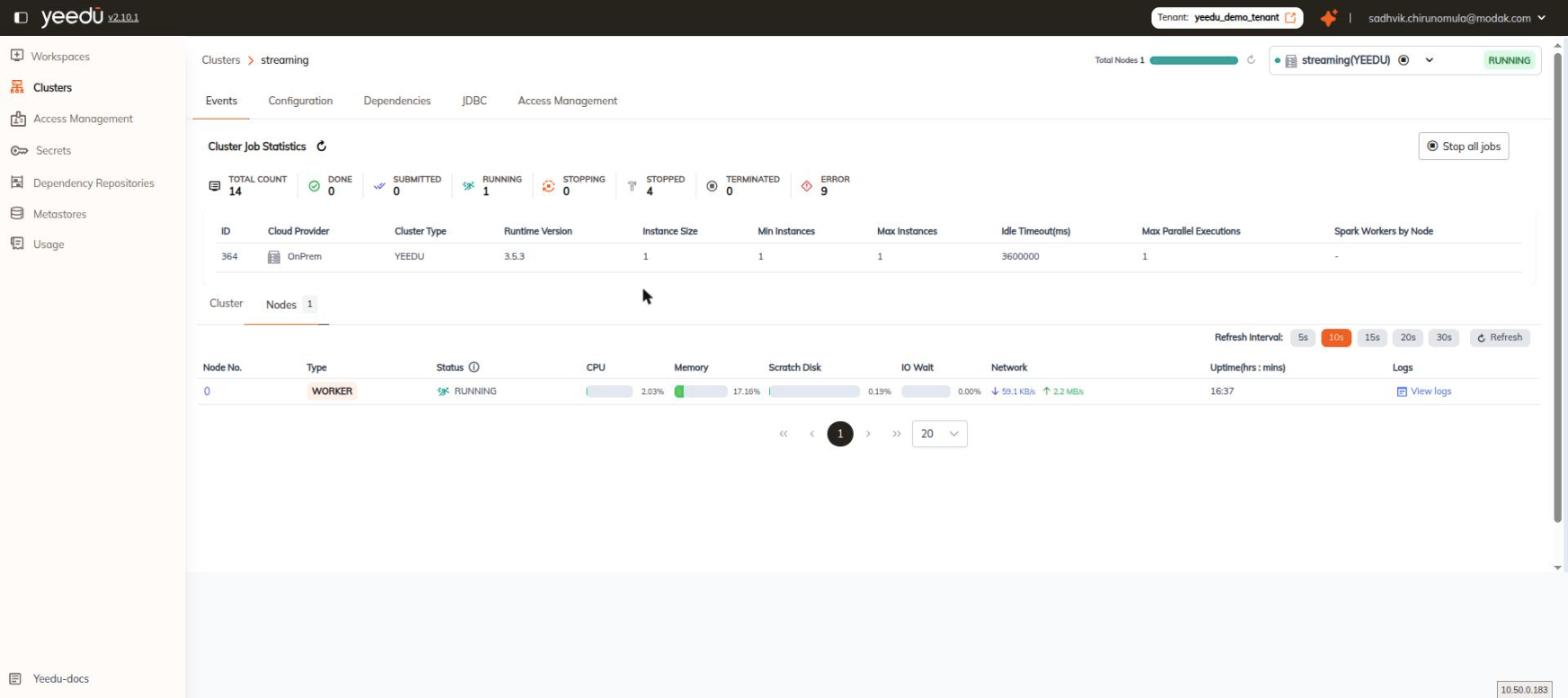
We document it in full on Node-Level Monitoring.
The other tabs
Configuration
The cluster edit form, with a live CLUSTER DETAILS summary panel on the right. The cluster must
be in the DESTROYED state before most fields can be edited. See
Edit & Delete Clusters.
Dependencies
Routes into the dependency repository attached to this cluster and renders the same three-pane file browser used under Dependency Repositories, scoped to that repository.
JDBC
One row per workspace that is allowed to attach to this cluster. The tab gives you a Search By
Workspace Name box, a Download Drivers button, a JDBC USERNAME card carrying the
signed-in user's email with a copy icon and a masked JDBC TOKEN card with a copy icon of its
own; the columns are Workspace Name, JDBC URL and Actions, where Actions is a
single copy-URL button, and the footer carries pagination with a page-size selector that defaults
to 20.
Access Management
The Access Control card, section Workspaces:
- A Select Workspace dropdown to grant a new workspace access
- A table of Workspace and Can Attach To, where Can Attach To is a per-row checkbox
- Footer pagination with a page-size selector (default
20)
This is what decides which workspaces may run jobs and notebooks on the cluster, and therefore which rows appear on the cluster's JDBC tab.
Starting and stopping a cluster
Both actions are on the cluster chip in the persistent header:
- Stop : the stop icon button on the chip. On a stopped cluster the same button becomes Start.
- Destroy : the chevron next to it opens a menu whose single item is Destroy.
See also Auto Suspension for idle-timeout driven shutdown.