Node-Level Monitoring
We report live per-node utilisation metrics, CPU, memory, scratch disk, IO wait, network and uptime, for every node in a cluster.
We keep the lifecycle history and the logs of each individual node alongside them.
Where node monitoring lives
- Open Clusters from the tenant navigation panel.
- Click a cluster name to open its detail page.
- Open the Events tab.
- Select the Nodes sub-tab.
There's no top-level Nodes tab on the cluster detail page. The cluster detail page has five tabs, Events, Configuration, Dependencies, JDBC and Access Management, and node monitoring is the Nodes sub-tab inside Events, alongside the Cluster sub-tab.
The sub-tab label carries the provisioned node count, for example Nodes 1.
Nodes sub-tab
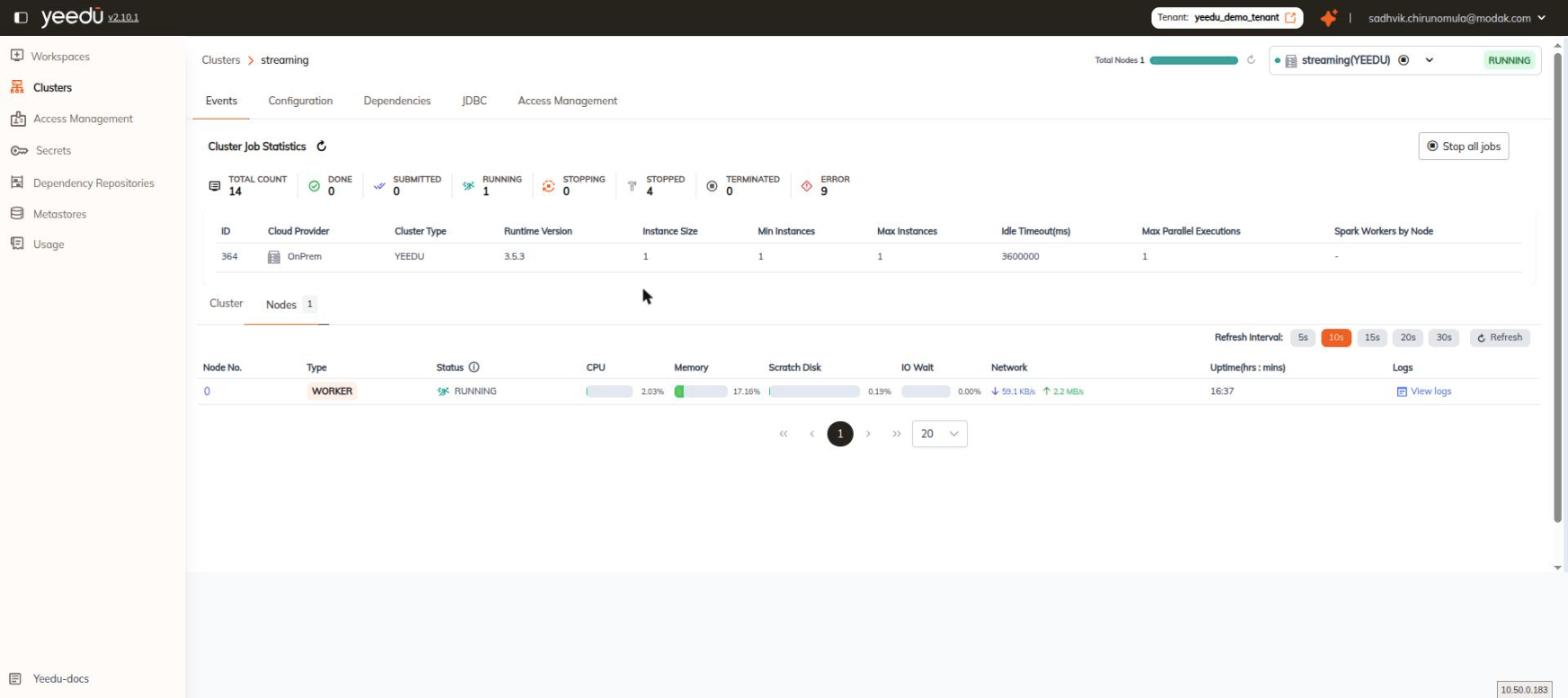
The table has ten columns:
| Column | What it shows |
|---|---|
| Node No. | The node's number. It's a link. Clicking it opens the Details for Node N dialog. |
| Type | A chip identifying the node's role: WORKER, or MASTER on multi-node clusters. |
| Status | The node's current lifecycle state, with an info tooltip. |
| CPU | CPU utilisation, as a mini progress bar plus a percentage. |
| Memory | Memory utilisation, as a mini progress bar plus a percentage. |
| Scratch Disk | Scratch disk utilisation, as a mini progress bar plus a percentage. |
| IO Wait | IO wait, as a mini progress bar plus a percentage. |
| Network | Two live rates — a download rate and an upload rate (for example 59.1 KB/s down and 2.2 MB/s up). |
| Uptime(hrs : mins) | How long the node has been up, as hrs:mins (for example 16:37). |
| Logs | A View logs link that opens the Node Log : N dialog. |
A footer provides first/previous/next/last pagination controls and a configurable page size,
defaulting to 20.
Refresh controls
The Nodes sub-tab shares the Events tab's right-aligned control row:
- Refresh Interval: a segmented control with 5s, 10s, 15s, 20s and 30s. 10s is the default.
- A Refresh button for an immediate refresh.
Node status values
| Status | Meaning |
|---|---|
| STARTING | The node's instance is being launched |
| BOOTSTRAPPING | The node is running its bootstrap steps |
| RUNNING | The node is up and available to the cluster |
| STOPPING | The node is shutting down |
| STOPPED | The node is stopped |
| DESTROYING | The node's resources are being torn down |
| DESTROYED | The node has been removed |
| ERROR | The node failed |
Details for Node N dialog
Clicking a value in the Node No. column opens the Details for Node N dialog.
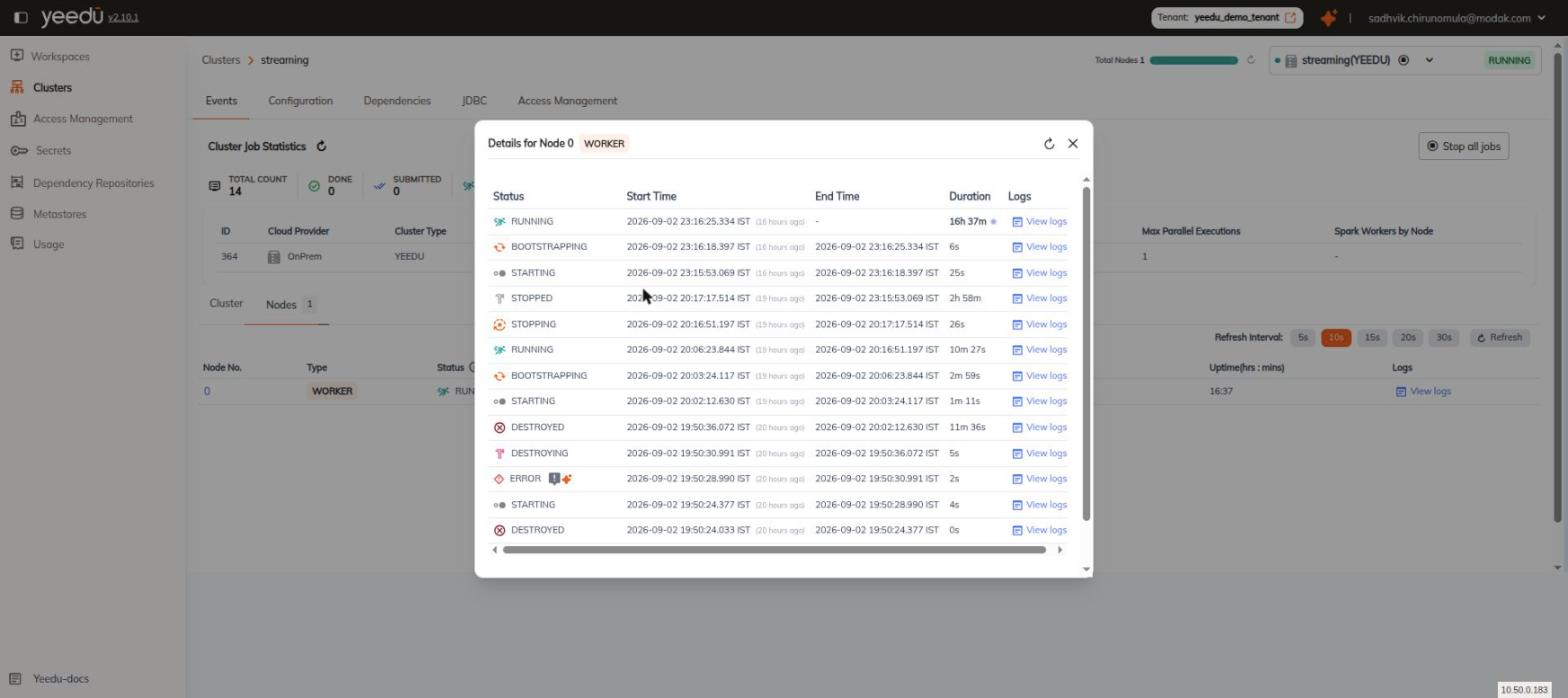
The title reads Details for Node 0, followed by the node's type chip (WORKER), and the
dialog header carries a refresh icon and a close icon. The body is a horizontally
scrollable table with one row per node state transition:
| Column | Description |
|---|---|
| Status | The state this transition entered |
| Start Time | When the state was entered |
| End Time | When the state ended |
| Duration | How long the state lasted |
| Logs | A View logs link, per transition |
A row whose status is ERROR renders two extra icon buttons beside the status: a copy icon and
the AssistantX icon, which runs a one-click diagnosis of the underlying error.
Node Log : N dialog
You reach this one through View logs, either from the Logs column on the Nodes table or from a row of the Details for Node N dialog, and we title it after the node whose output stream you are inspecting.
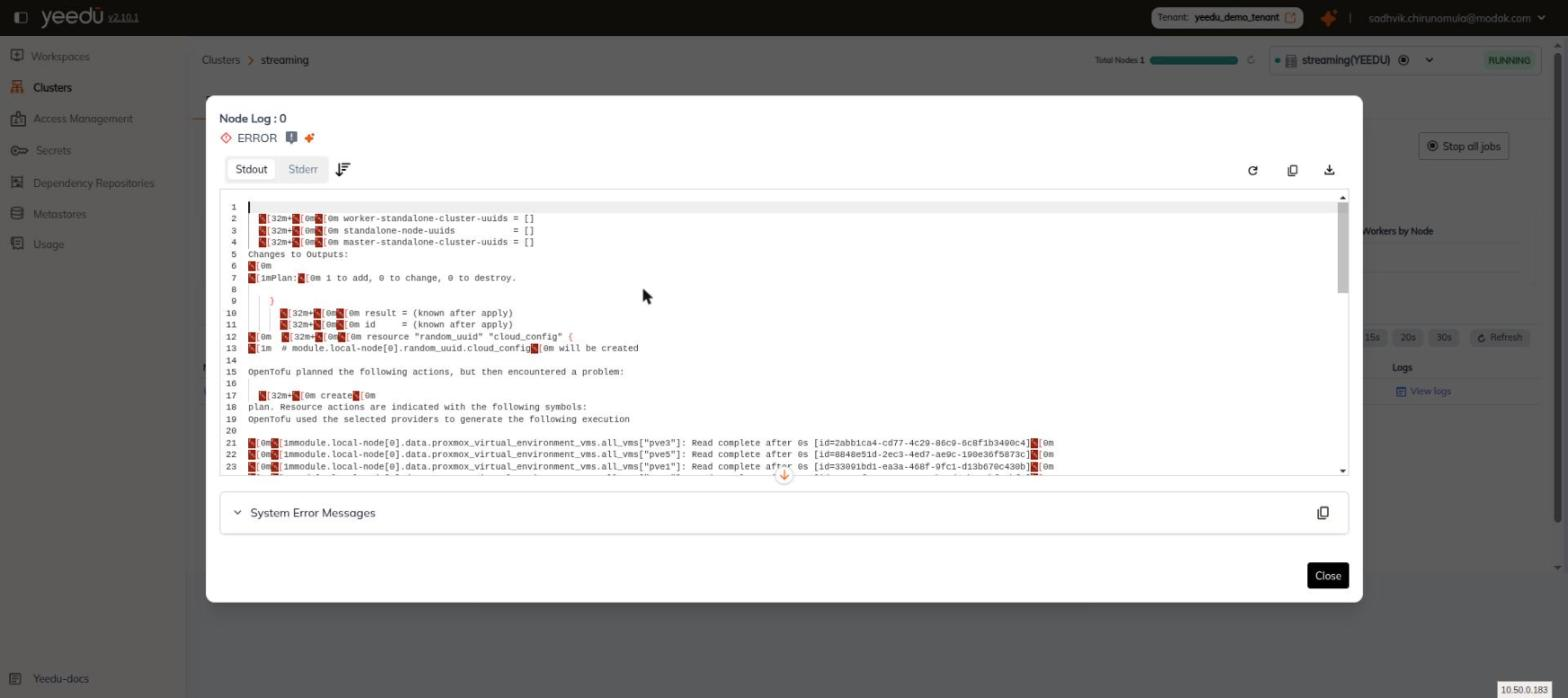
| Control | Description |
|---|---|
| Title | Node Log : 0, followed by the status chip for the transition being viewed (RUNNING, ERROR, and so on). On an ERROR chip the copy and AssistantX icons appear here too. |
| Stdout / Stderr | A segmented toggle that switches the stream being displayed. |
| Sort order | An icon that flips the log between oldest-first and newest-first. |
| Refresh | Re-fetches the log. |
| Copy | Copies the displayed log. |
| Download | Downloads the log. Present for terminal states; it isn't shown while a log is still streaming. |
| Log body | The log lines, with line numbers and a floating scroll-to-bottom button. |
| System Error Messages | A collapsible panel at the bottom, with its own copy icon, holding the system-level error messages for the node. |
| Close | Dismisses the dialog. |
Cluster-level events
The Cluster sub-tab, next to Nodes, carries the cluster's own lifecycle events, newest
first: the status, who triggered the transition, the start and end times, and the duration
humanised as 16h 36m or 34s. Its Triggered By column shows the email address of whoever
initiated the transition, or -- when the platform initiated it, and the statuses it walks through
are INITIATING, RUNNING, STOPPING, STOPPED, DESTROYING, DESTROYED and ERROR. Both
sub-tabs share the same right-aligned control row, so the
10s refresh interval selected on Nodes also determines how frequently Cluster re-polls. See
Monitoring.