Workspace Runs
The Runs tab is the landing tab of a Workspace. It combines a statistics strip summarising every run in the Workspace with a filterable table of the individual run records for Jobs and Notebooks.
Route:
/workspace/<id>/runs?pageNumber=1&limit=20
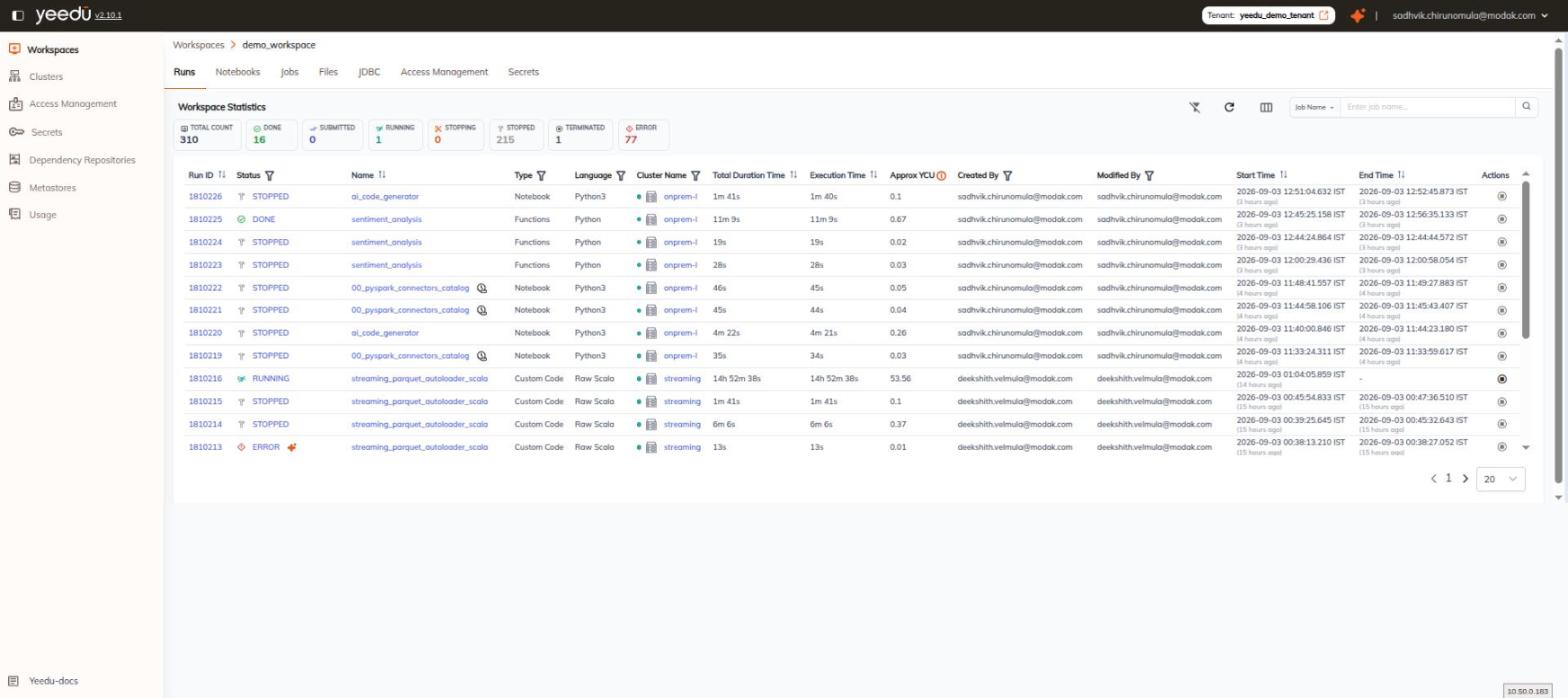
Workspace Statistics
A card headed Workspace Statistics sits above the table. It holds eight counters: TOTAL COUNT plus one counter for each of the seven run statuses. Each counter carries its own status icon and colour, matching the icon rendered in the Status column of the table below. The seven statuses counted are DONE, SUBMITTED, RUNNING, STOPPING, STOPPED, TERMINATED and ERROR.
| Counter | What it counts |
|---|---|
| TOTAL COUNT | Every run recorded in this Workspace. |
| DONE | Runs that completed successfully. |
| SUBMITTED | Runs accepted and waiting to start. |
| RUNNING | Runs currently executing. |
| STOPPING | Runs in the process of being stopped. |
| STOPPED | Runs that were stopped. |
| TERMINATED | Runs that were terminated. |
| ERROR | Runs that failed. |
Toolbar
| Control | Description |
|---|---|
| Clear all filters | Removes every active column filter in one click. |
| Refresh | Re-fetches the run list. |
| Column options | Opens a popover of toggleable optional columns. |
| Search-mode selector | A dropdown with two options, Job Name (default) and Run ID, that decides what the adjacent search input matches. |
| Search input | Filters the table by the value chosen in the selector. With Job Name selected the placeholder reads Enter job name.... |
The Column options popover controls exactly four columns, which you can show or hide:
- Created By
- Modified By
- Start Time
- End Time
Columns
The table has 14 columns.
| Column | Description |
|---|---|
| Run ID | Identifier of the run, rendered as a link. Sortable. |
| Status | Run status, shown as a status chip with an icon. Filterable. |
| Name | Name of the Job or Notebook, rendered as a link. Notebook runs also show a small preview icon after the name. Sortable. |
| Type | What kind of workload produced the run. Filterable. |
| Language | Language the run executed in. Filterable. |
| Cluster Name | Cluster the run executed on. Filterable. |
| Total Duration Time | Total wall-clock duration of the run. Sortable. |
| Execution Time | Time spent actually executing. Sortable. |
| Approx YCU | Approximate Yeedu Compute Units consumed. Its ⓘ tooltip reads: YCU stands for Yeedu Compute Unit. 1 YCU/hour = Cores/4 + Memory/10. |
| Created By | User who created the run. Filterable. Optional column. |
| Modified By | User who last modified the run. Filterable. Optional column. |
| Start Time | When the run started. Optional column. |
| End Time | When the run ended. Optional column. |
| Actions | A single Stop button. |
Actions column
The Actions column holds one Stop button and nothing else. There's no kebab menu on this table. We render the button disabled for runs that can't be stopped, such as runs already in STOPPED or DONE.
AssistantX on failed runs
We put an AssistantX icon beside the status chip on rows whose status is ERROR. Use it to get a one-click diagnosis of why the run failed.
Filtering
Columns marked as filterable carry a filter icon in the header. Clicking it opens a filter popover containing:
- a checkbox list of the available values,
- a summary line that reads
No selected itemuntil you tick something, - a Clear button that unticks everything, and
- an Apply button that commits the selection to the table.
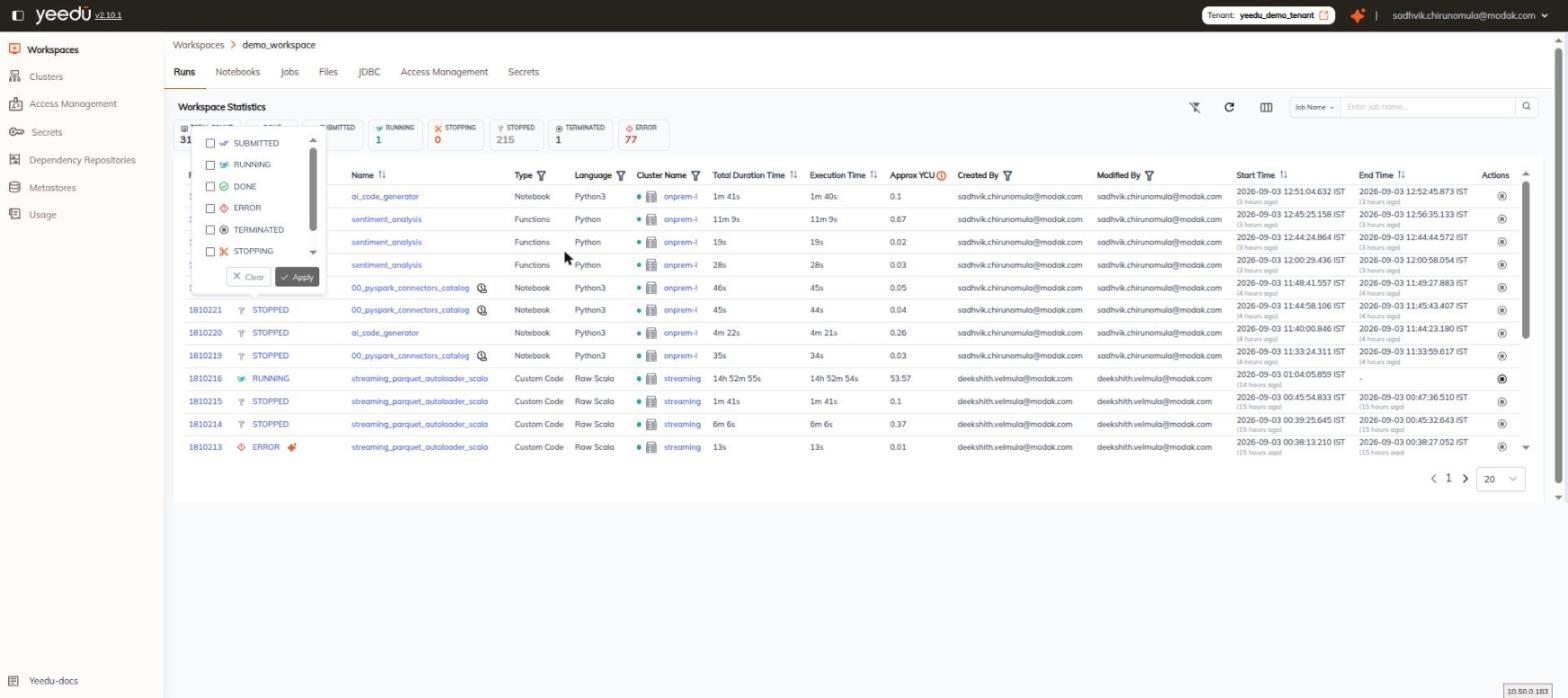
Cluster Name, Created By, and Modified By are data-driven. Their checkbox lists are built from the clusters attached to the Workspace and the users present in the run history. Status, Type, and Language are fixed enumerations, listed below.
Status
| Value |
|---|
SUBMITTED |
RUNNING |
DONE |
ERROR |
TERMINATED |
STOPPING |
STOPPED |
Type
| Value |
|---|
JAR |
Functions |
Custom Code |
Notebook |
Thrift SQL |
Language
| Value |
|---|
Raw Scala |
Python |
Python3 |
Scala |
Thrift SQL |
SQL |
Spark SQL |
The values above are listed in the order they appear in each filter popover.