Error Diagnosis
Diagnose hands a failed event straight to Yeedu Assistant with the object's identifiers already in context, so you don't have to copy run IDs or paste logs into the drawer yourself.
Where the Button Appears
Diagnose is an orange sparkle affordance that sits immediately right of the status. It appears
only on rows whose status is ERROR. DONE, STOPPED, RUNNING and blank rows never carry
it. It has no tooltip; the label is the affordance.
It shows up in four places, in two slightly different forms.
On Events tables: hover-only
In an Events table the button is not on the row at all until you hover it; hovering reveals
the full orange Diagnose button.
| Location | |
|---|---|
| Job or notebook run detail ▸ Run tab ▸ Events table | 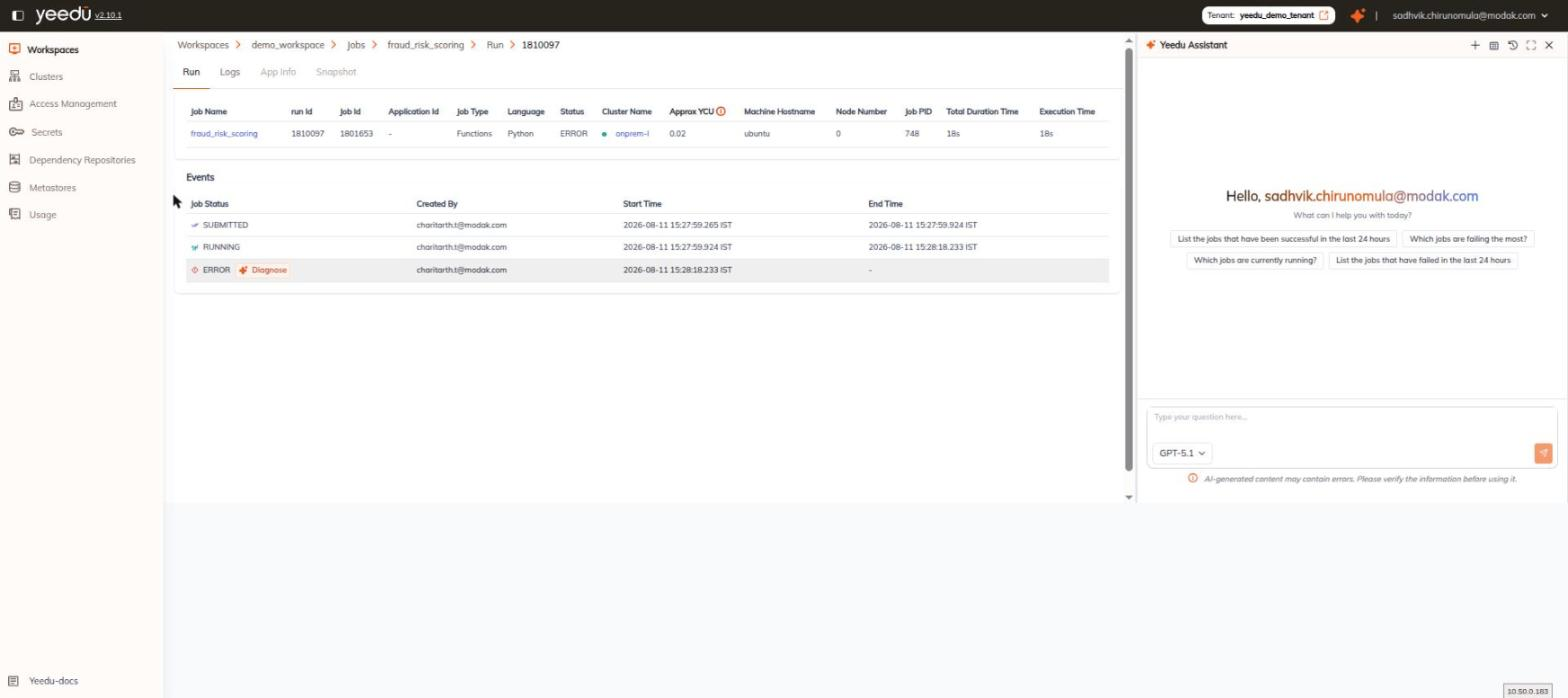 |
Cluster ▸ Events ▸ Cluster sub-tab | 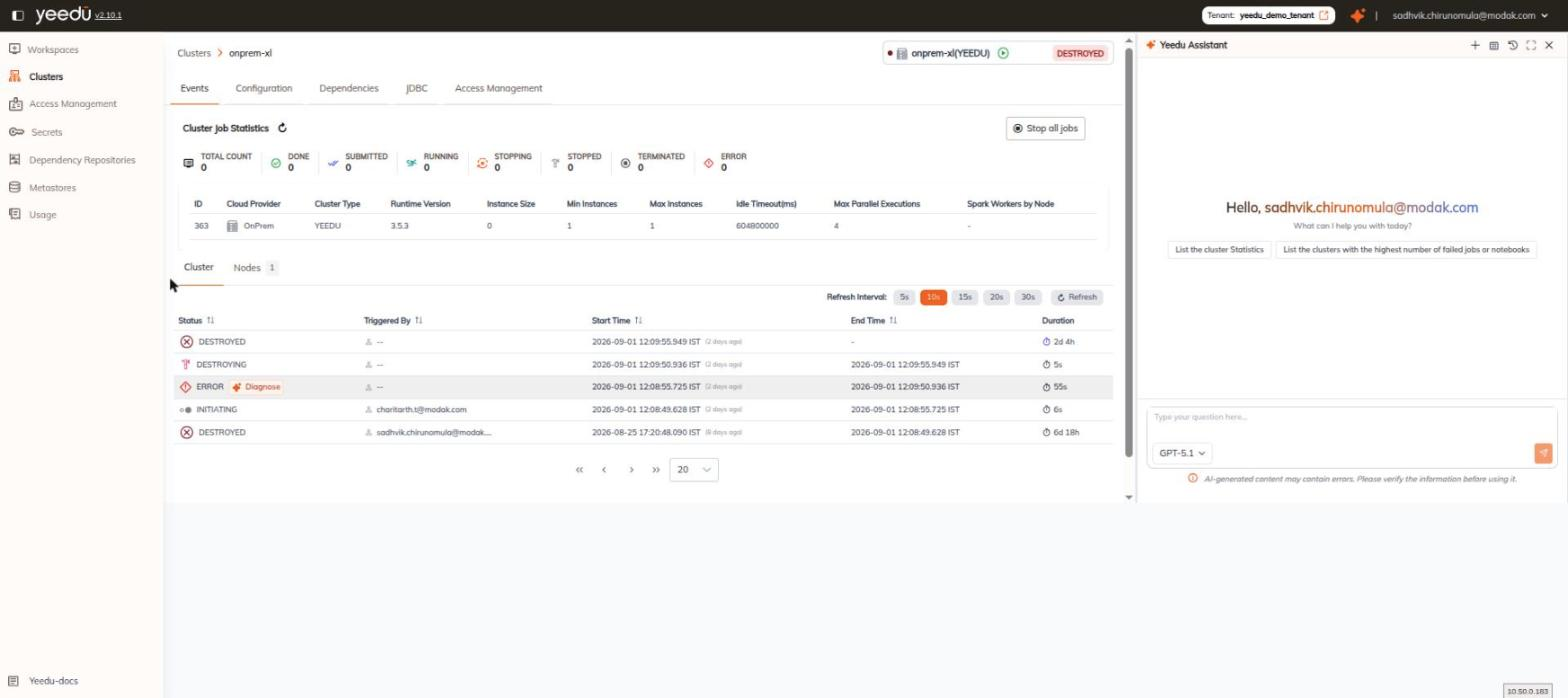 |
On list pages: a persistent sparkle that expands
On the two workspace list pages the sparkle glyph is always drawn beside the ERROR label, so
you can see at a glance which rows can be diagnosed. Hovering the glyph expands it into the same
orange Diagnose pill.
| Location | Column |
|---|---|
| Workspace ▸ Runs | Status |
| Workspace ▸ Jobs | Last Run Status |
Run detail pages are reached from a run table such as Workspace Runs;
the Jobs Dashboard is the workspace Jobs tab; the cluster Events tab is
described in Cluster Monitoring.
What Happens Next
Clicking Diagnose opens Yeedu Assistant with that object's identifiers already in context. The conversation then proceeds in three stages:
- The assistant restates the context it was handed: for a run, values such as
Workspace ID: 298andJob Run ID: 1810097. - It asks you to confirm before acting, and lists what it intends to do: fetch the run details (status, timings, cluster, YCU), pull the STDERR and STDOUT logs, pull engine-level job errors, and summarise the root cause with concrete fix recommendations covering code, configuration and cluster.
- On your confirmation it runs those calls, each rendered as a tool-call card you can expand to see the exact request and response, and returns a structured answer with sections such as
1. What happened,Run detailsand4. Recommended next steps.
The assistant does not act on the error until you confirm. Nothing is changed on the cluster or the run either way. The diagnosis is read-only; it reads details, logs and errors, and recommends fixes for you to apply.
We documented this flow from a completed diagnosis thread read back from History rather than from triggering the button. The stages and the resulting answer shape above are what that conversation shows; we have not verified the exact wording of the prompt the button seeds.